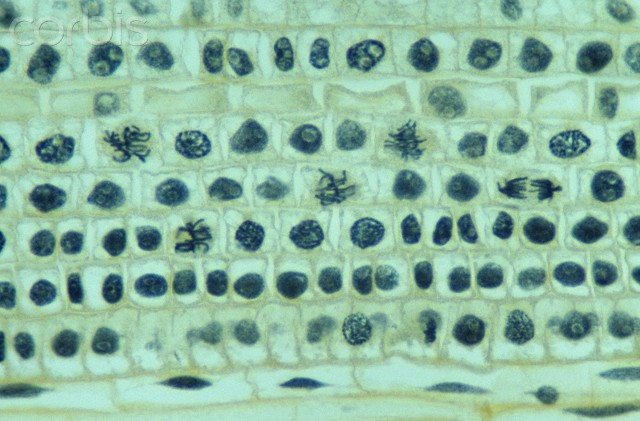
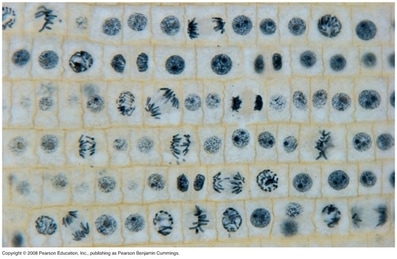
The purpose of this lab is to review the phases of meiosis before the assessments covering 5.2. In order to complete this lab, you will need to borrow the materials from Mrs. H to take home and complete the lab. Use the lab instructions to work through the questions on your lab 14 sheet. Below is a picture of what your chromatids should look like after you make them.
Part A: Complete part A analyzing the activity of restriction enzymes used to cut DNA into fragments. If you need help, please see Mrs. H. Part B: Now that our DNA has been cut into fragments, we can undergo gel electrophoresis, which is Part B. Read the process that we went through to setup our gel electrophoresis experiment. Then use the image below and analyze for the results. 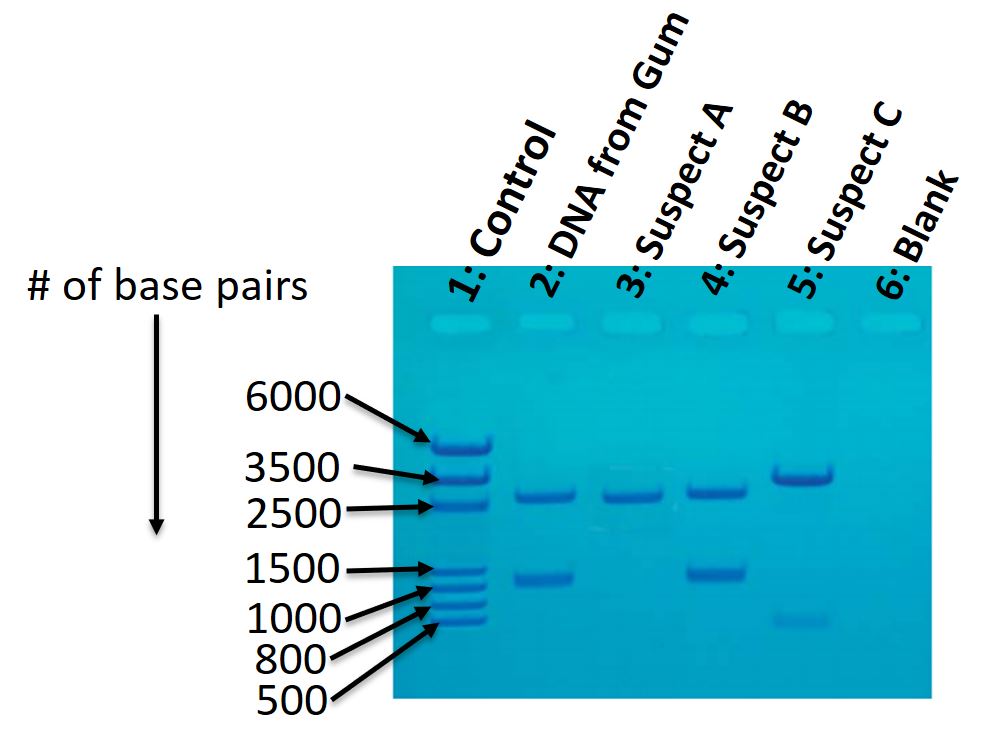
Use the data below to complete Lab 12 (sorry you missed out because it was super awesome!) Data Table: 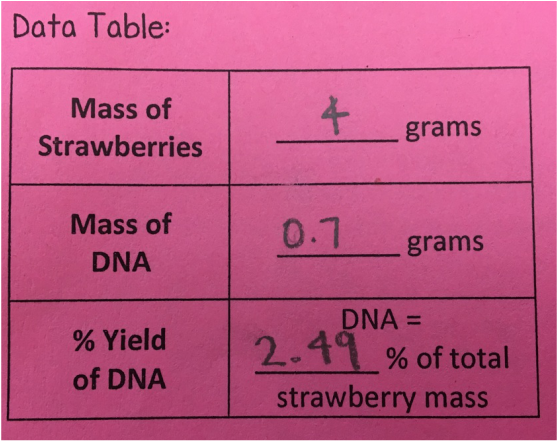 Picture of Extracted DNA (for diagram):  Day 1: Lab setup, before yeast has had a chance to begin respiring. Containers in order: Control, Glucose, Sucrose, Lactose, Starch 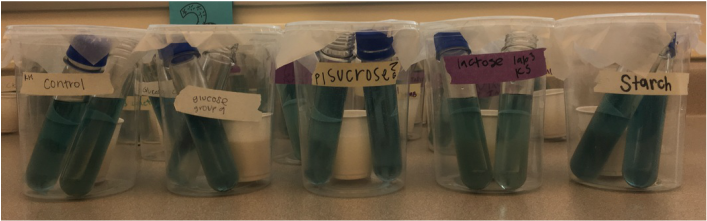 Day 2: After 24 hours of yeast performing cellular respiration (or not!) Use the instruction sheet to help you answer any pre or post lab questions! Containers in order: Control, Glucose, Sucrose, Lactose, Starch 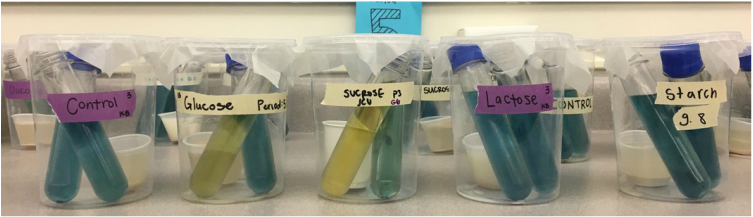
If you missed this lab, you have two options:
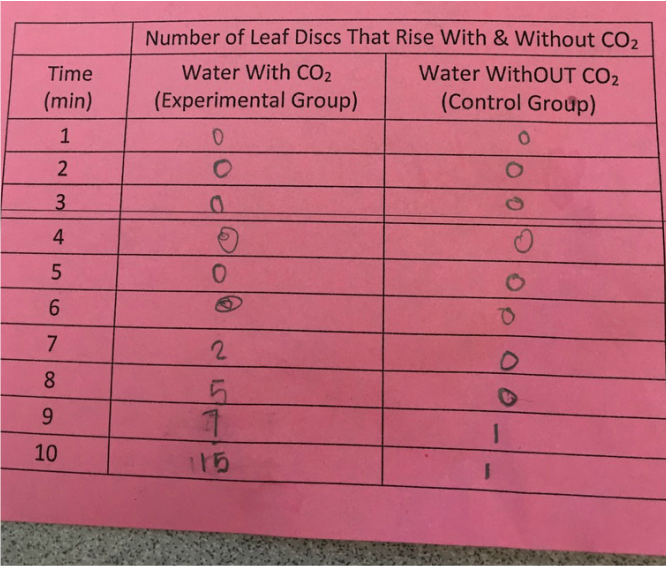
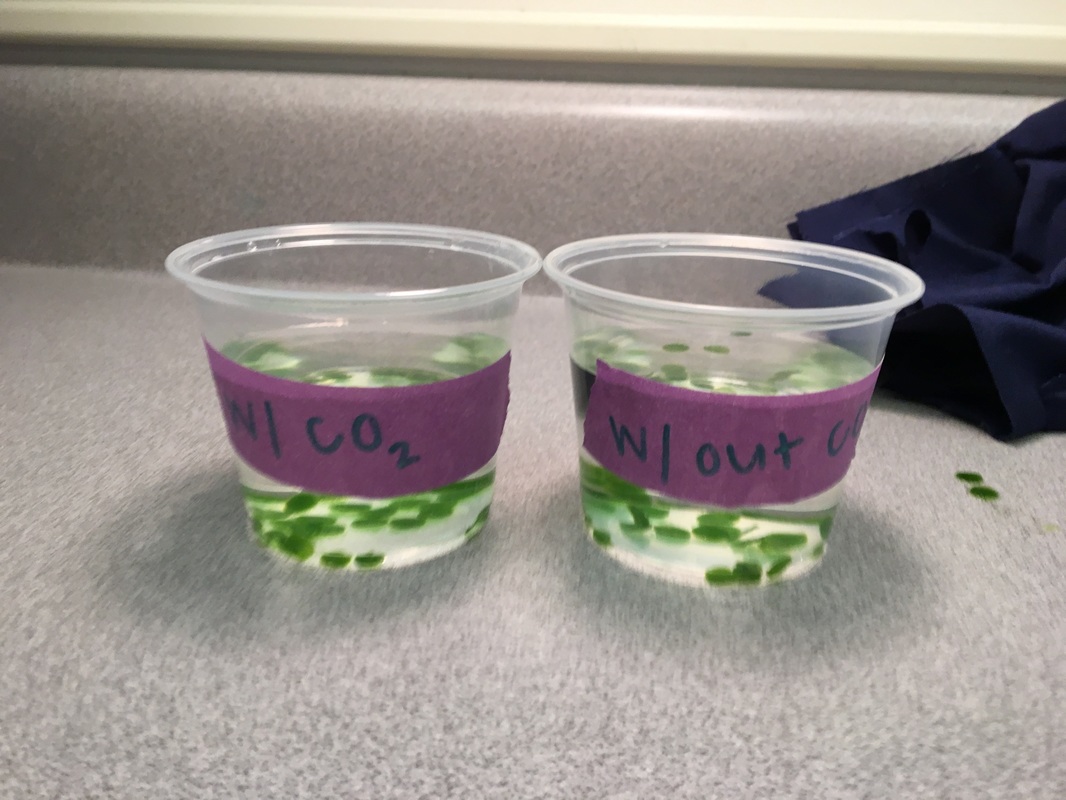
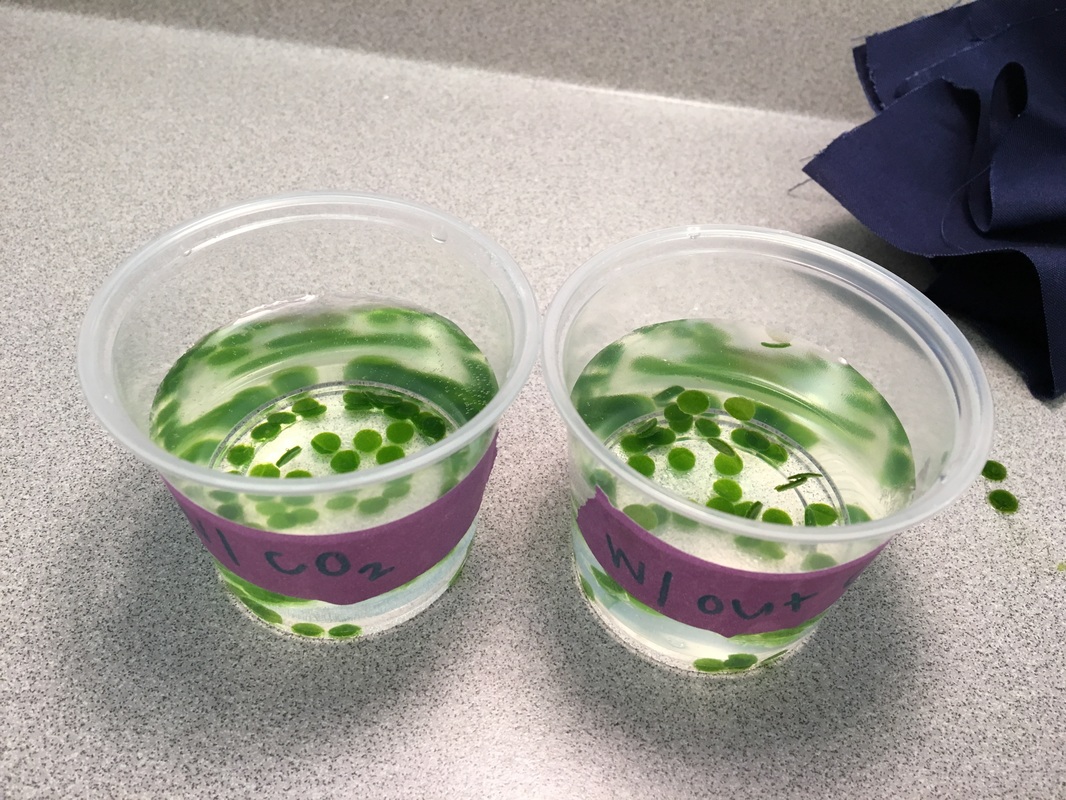
  Attached below are the instructions for Lab 9. The focus of this lab was to measure the rate of photosynthesis by watching leaf discs rise. The leaves will rise from the bottom of a cup as O2 gas is produced as photosynthesis takes place. Below are pictures showing the lab setup and the data from one lab group in Period 2. Use the data to complete your lab sheet.
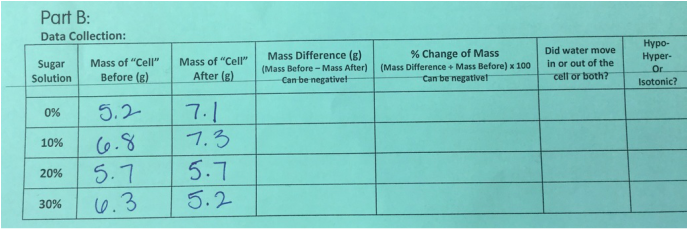
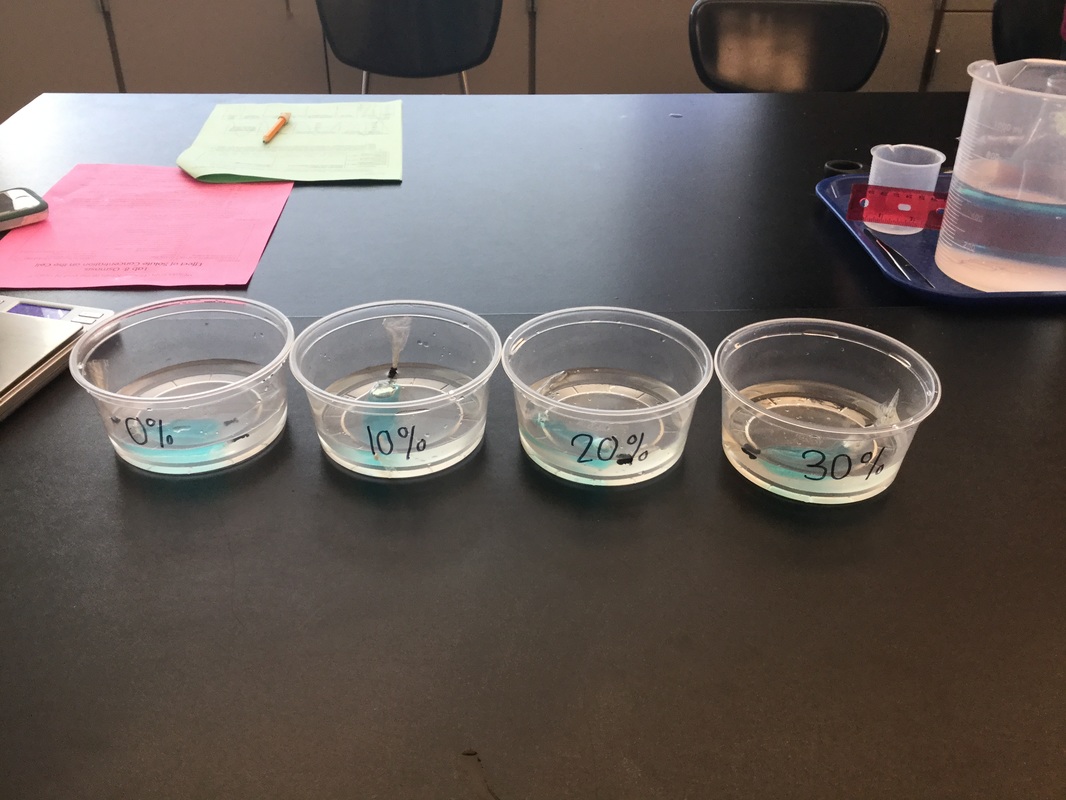
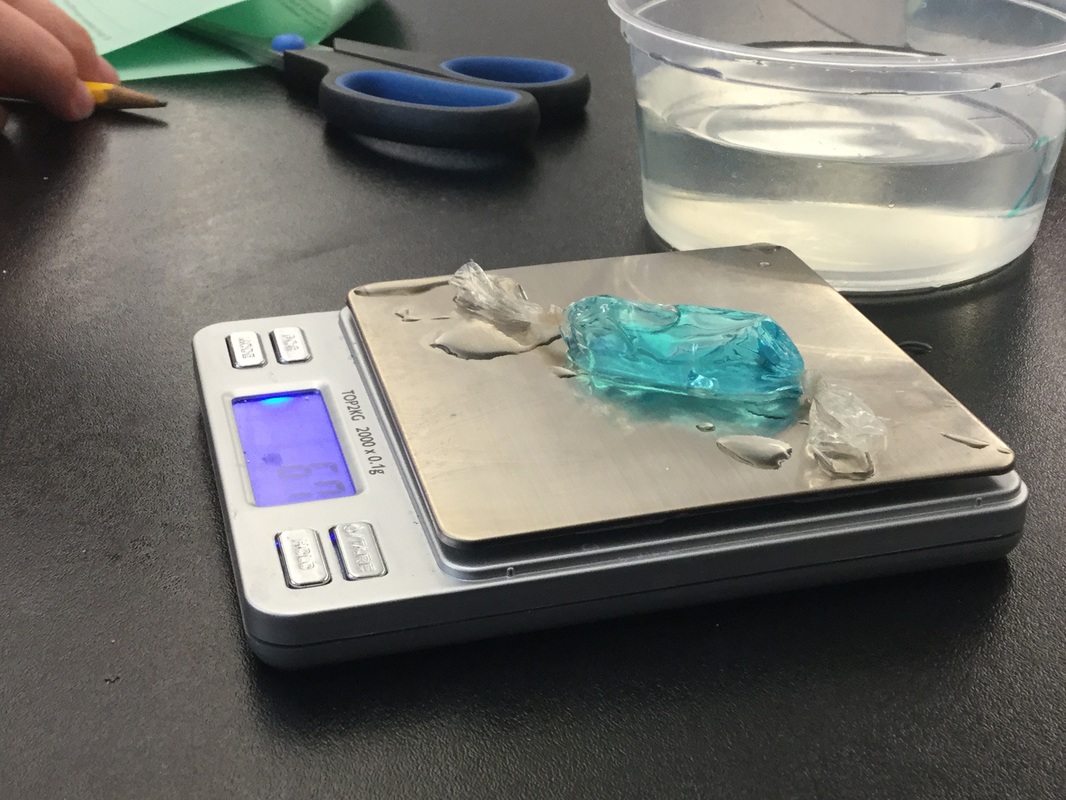
 In this lab, we created cells using dialysis tubing, a semi-permeable film that is made in a tube shape. Inside the dialysis tubing, we put an UNKNOWN sugar solution inside the tubing (dyed blue), We made four of these. Then we put each dialysis tubing "cell" in a KNOWN concentration of sugar water: 0% sugar, 10% sugar, 20% sugar, and 30% sugar. Below are pictures of the lab set up. We measured the mass of the cells before and after being exposed to the different sugar solutions. If a cell gained mass, it was in a hypotonic solution. If a cell lost mass, it was in a hypertonic solution. If its mass was the same or nearly the same, it was in an isotonic solution. Use the data below to complete your lab packet.
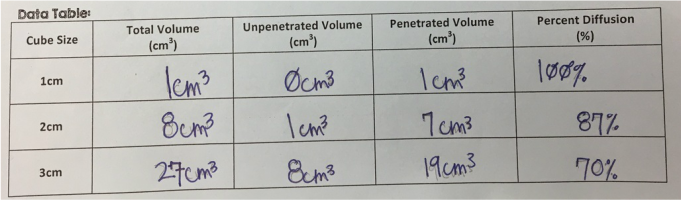
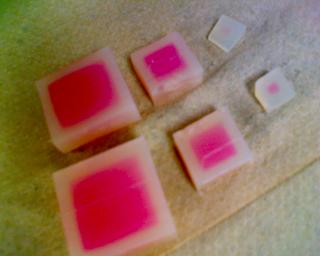
 Part A: Diffusion - observe the cubes below to visually identify which cube had the highest percentage of diffusion. The data table below has the measurements of the agar cubes. Use the data to complete your lab packet.
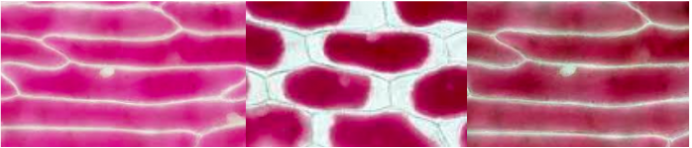
 Part B: Osmosis - observe the pictures below that show red onion cells before (picture 1), after exposure to 15% salt water (picture 2), and after having salt water replaced with distilled (pure) water (picture 3). Use the pictures to complete your lab packet.
 Also...here is a cool video of osmosis happening in red onion cells in real time! If you missed Lab 6, observe the pictures below to complete your lab observations. Answer the pre and post lab questions as well.
|
||||||||||||||||||||||||||||||||||


 RSS Feed
