|
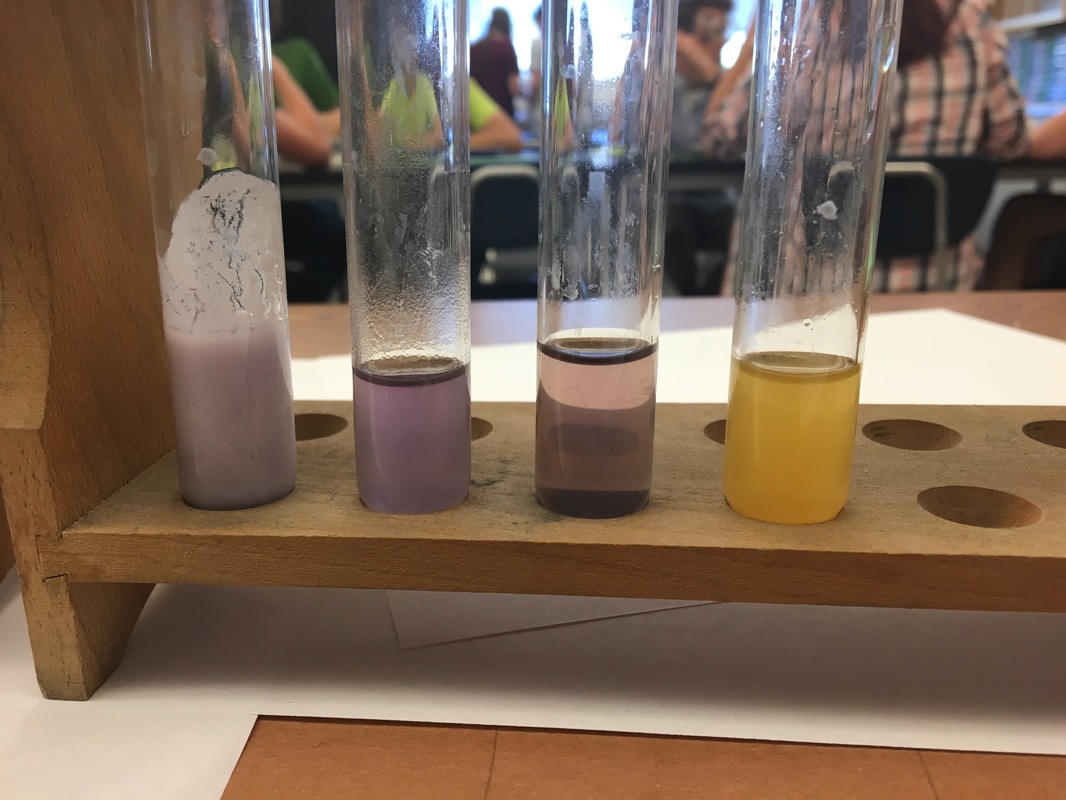
Use the data below to complete the lab packet. Remember: all three data sets (pH, temperature, and amount of reactant) are continuous data and will require you to make LINE graphs. 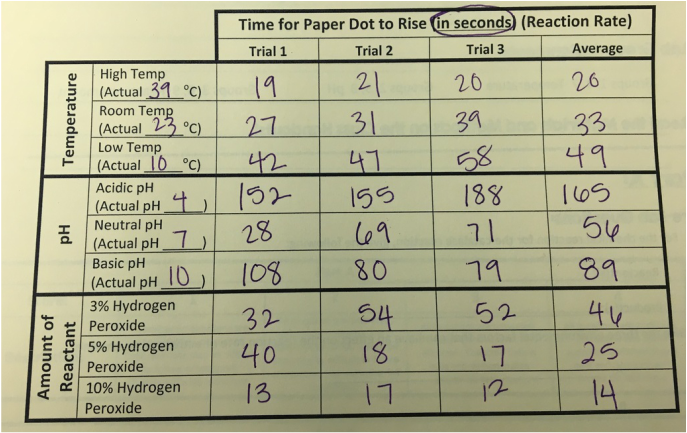 Observe the pictures for each test. The test tubes are IN ORDER compared to your data table (water, white sugar, oil, potato, egg, apple juice, whole milk, yogurt, chicken broth, honey) Food Substances BEFORE Any Chemicals Are Added:
Lipid Test: (two are positive) 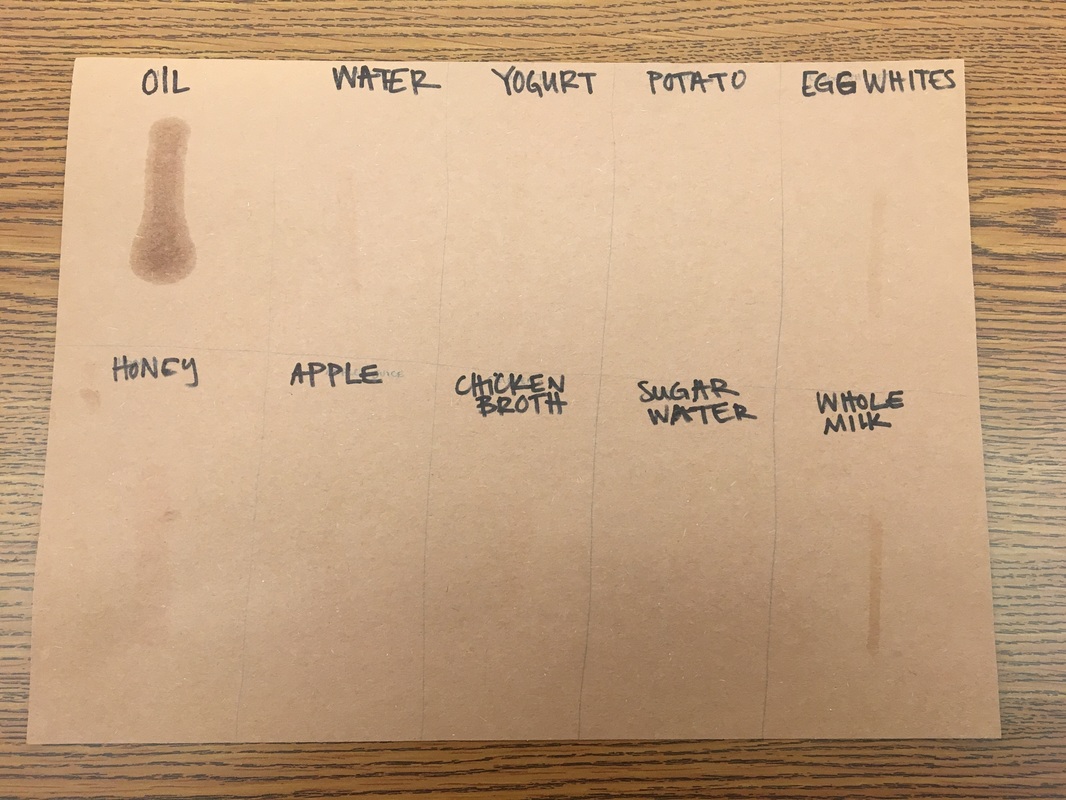 Simple Carbohydrates (Monosaccharides only!): (three are positive)
Complex Carbohydrates (Polysaccharides only!): (there are only two positives that turn black!)
Proteins: (four are positive)
Use the data below to complete your lab 2. You will need to calculate the area of the rectangles, THEN create your graph. Once you have done this, THEN you can interpolate the area of the irregular sample (1A). If you need help, please see Mrs. H! For this lab, all you will need is the data below and some colored pencils or markers.  |


 RSS Feed
